Response 2
In the video, First steps in computer vision, Laurence Maroney introduces us to the Fashion MNIST data set and using it to train a neural network in order to teach a computer “how to see.” One of the first steps towards this goal is splitting the data into two groups, a set of training images and training labels and then also a set of test images and test labels. Why is this done? What is the purpose of splitting the data into a training set and a test set?
- The goal of computer vision is to teach the computer to recognize the characteristics of images. We do not know exactly what characteristics the computer is identifying. Quite frankly, it does not matter to us as long as the computer is successful. However, in order to make the connections the computer needs to have images and answers to “learn” on. The training images and the training labels are provided to our computer. This allows the computer to learn the characteristics that connect the images to the labels. In order to see how well the computer has learned the connections, we withold a cetain amount of data. It would not make sense to test the computer on data it already knows. We want to see how well the computer will do at classifying new images or our test images.
The fashion MNIST example has increased the number of layers in our neural network from 1 in the past example, now to 3. The last two are .Dense layers that have activation arguments using the relu and softmax functions. What is the purpose of each of these functions. Also, why are there 10 neurons in the third and last layer in the neural network.
- The purpose of the relu function is to remove the negative numbers from our model. It sets negative numbers to zero which will keep that specific neuron at zero for the rest of the compilation. The softmax function is needed for our last layer because the neural network returns the probability that it is x item of the ten possible items. The softmax function sets the highest probability to one, and all other probabilities are set to zero. Thus, our model returns a label instead of a probability. There are ten neurons in the last layer because we are trying to determine between ten possible items. As stated above, each neuron in this layer contains a probability that it is the item associated to that neuron. If we were trying to classify eleven items, the last layer would have eleven neurons and so on and so forth.
In the past example we used the optimizer and loss function, while in this one we are using the function adam in the optimizer argument and sparse_categorical- crossentropy for the loss argument. How do the optimizer and loss functions operate to produce model parameters (estimates) within the model.compile() function?
- Adam is an algorithm that is often used when working with computer vision. In computer vision, the model is working with cast amounts of data. This could complicate a regular stochastic gradient descent optimizer because it may not shoose the same path each time you compile the model. Adam improves performance on the stochastic gradient descent when working with large data types. Further Adam adapts its parameters based on the steepness of the descent which allows Adam to handle noise well. ‘Sparse_categorical_crossentropy’ is a categorical crossentropy with integer targets. It is used to label the parameters into a classification with an associated integer value (0-9 in the fashion_mnist dataset).
Using the mnist drawings dataset (the dataset with the hand written numbers with corresponding labels) answer the following questions.
What is the shape of the images training set (how many and the dimension of each)?
- There are 60,000 images with 28x28 pixels.
What is the length of the labels training set?
- The length of the labels training set is 60,000.
What is the shape of the images test set?
- There are 10,000 images with 28x28 pixels.
Estimate a probability model and apply it to the test set in order to produce the array of probabilities that a randomly selected image is each of the possible numeric outcomes (look towards the end of the basic image classification exercises for how to do this — you can apply the same method applied to the Fashion MNIST dataset but now apply it to the hand written letters MNIST dataset).
Use np.argmax() with your predictions object to return the numeral with the highest probability from the test labels dataset.
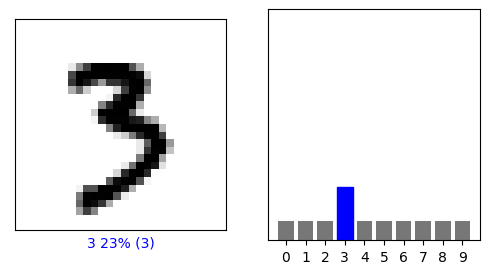
Produce a plot of your selected image and the accompanying histogram that illustrates the probability of that image being the selected number

